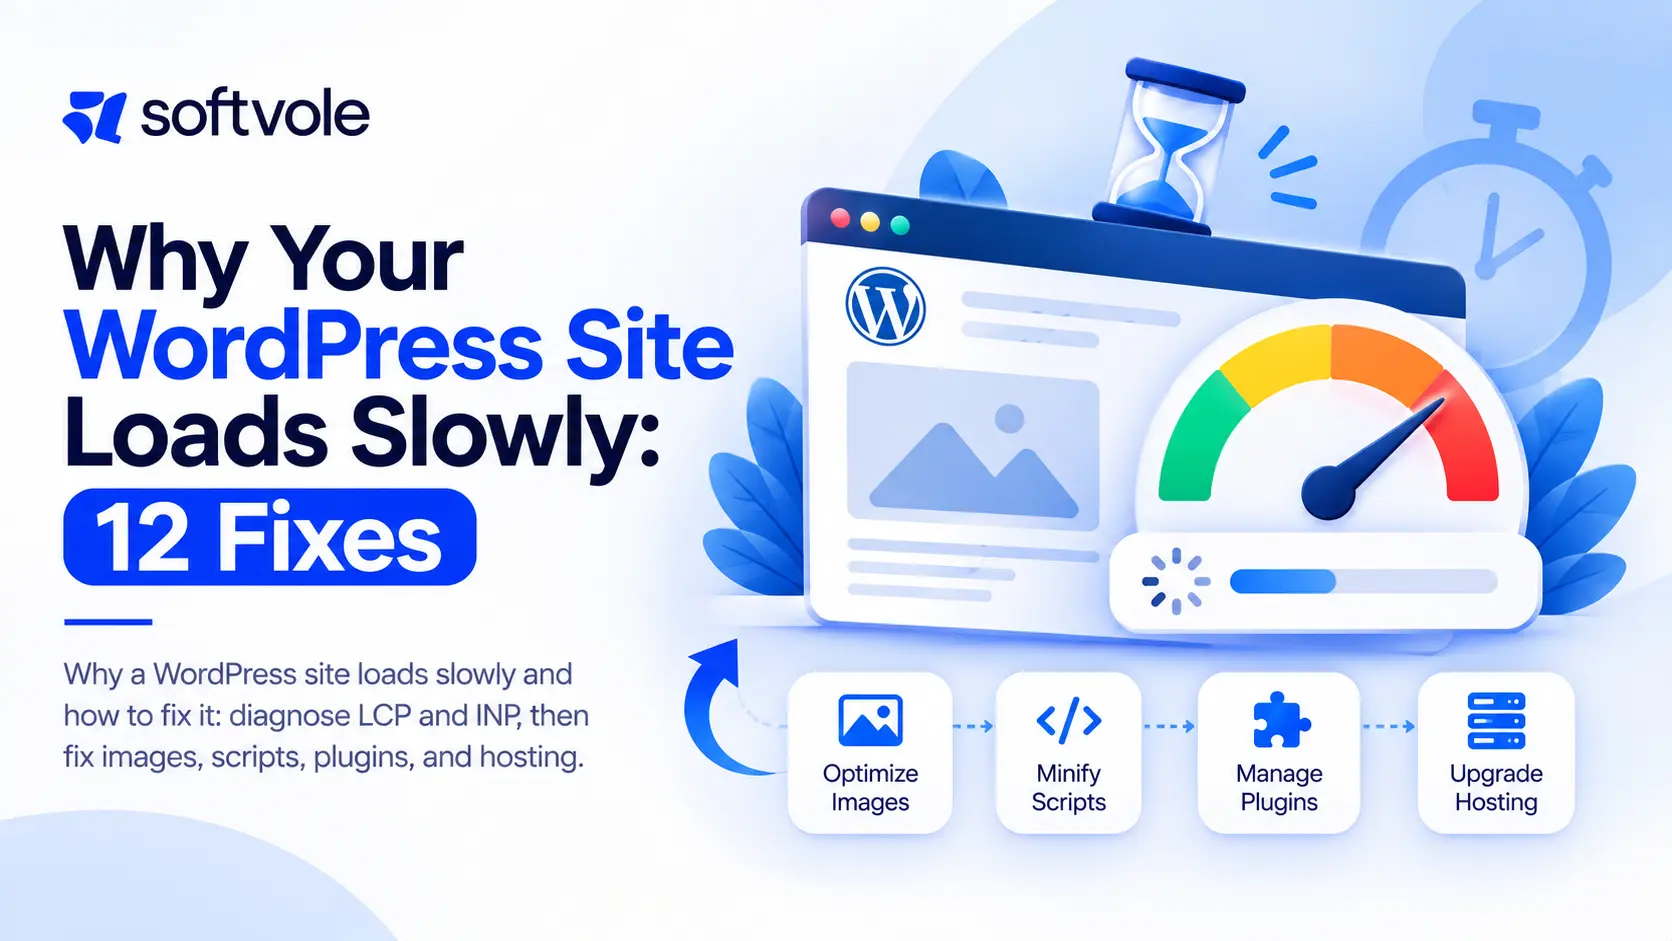
When a WordPress site loads slowly, adding another caching plugin is usually the first fix people try and the least likely to solve it. Slow sites have specific causes: oversized images, too many third-party scripts, heavy page builders, slow database queries, or underpowered hosting. This guide shows how to find yours and fix it in order of impact.
Quick diagnostic workflow for client sites:
- Test three representative templates (home, a service page, a blog post or product) in PageSpeed Insights and note LCP, INP and CLS.
- Check field data in Search Console or the Chrome UX Report, because lab scores alone can mislead.
- Open the waterfall and find the largest image, slowest script and slowest server response.
- Fix the biggest cause first on staging, then retest the same templates with the same tool.
- Record before and after numbers and add the limits to a performance budget.
Core Web Vitals are Google’s user experience measures: LCP (loading, good at 2.5 seconds or less), INP (responsiveness, good at 200 ms or less) and CLS (visual stability, good at 0.1 or less). Stacking several optimization plugins as a quick fix often causes conflicts, double minification or broken layouts, so change one thing at a time and test on staging. The full workflow is explained later in this guide.
Diagnose Why a WordPress Site Loads Slowly
Why a WordPress site loads slowly: measure before you fix
Run a lab test (Lighthouse or PageSpeed Insights) on the homepage and two or three key templates, such as a service page and a product or post page. Then check field data from the Chrome UX Report in PageSpeed Insights. Lab data is repeatable and tells you what to fix. Field data reflects real visitors and tells you whether it worked.
| Metric | Measures | Good |
|---|---|---|
| Largest Contentful Paint (LCP) | Loading of the main content | 2.5 seconds or less |
| Interaction to Next Paint (INP) | Responsiveness to taps and clicks | 200 ms or less |
| Cumulative Layout Shift (CLS) | Visual stability | 0.1 or less |
Thresholds come from web.dev’s Core Web Vitals guidance. INP replaced First Input Delay as a Core Web Vital in March 2024, which made heavy JavaScript a bigger problem than it used to be.
12 Fixes in Order of Impact
1. Serve correctly sized, modern images
Uploading a 4,000-pixel photo for a 600-pixel slot is the single most common cause we see. Use responsive image sizes, modern formats such as WebP or AVIF, and an image CDN where possible.
2. Prioritize the LCP element
Make sure the hero image or headline loads first. Do not lazy load it, and give the hero image high fetch priority.
3. Audit third-party scripts
Chat widgets, heatmaps, review badges, and duplicate tracking tags pile up. Remove duplicates, delay non-essential widgets until interaction, and route tags through one tag manager container.
4. Remove unused plugins and load the rest conditionally
Plugin count matters less than what each plugin loads. A form plugin should not load its scripts on pages without a form.
5. Replace heavy page builders on key templates
Page builders often output deep, bloated markup. Moving high-traffic templates to native blocks or a custom block theme can cut page weight sharply.
6. Add full-page caching
Serve cached HTML to anonymous visitors through server or CDN caching. Exclude carts, checkouts, and logged-in areas.
7. Add object caching
Redis or Memcached object caching reduces repeated database queries, especially on WooCommerce and membership sites.
8. Fix slow database queries
Use a query monitoring tool to find slow or duplicated queries. Missing indexes on custom tables and bloated wp_options autoload data are common culprits.
9. Upgrade PHP
Newer PHP versions run WordPress faster and are supported longer. WordPress.org recommends PHP 8.3 or greater.
10. Use a CDN
A CDN serves static files from locations near the visitor, which helps national and international audiences.
11. Reduce web font weight
Load only the font weights you use, host fonts efficiently, and use font-display swap to avoid invisible text.
12. Move to better hosting
If server response time stays above about 600 ms after caching, the host is likely the bottleneck. Our host migration checklist covers moving safely.
Symptoms and Likely Causes
| Symptom | Likely cause | First fix |
|---|---|---|
| Slow LCP on mobile only | Large hero image | Responsive images, priority loading |
| Poor INP | Heavy JavaScript, chat and tracking scripts | Delay and remove scripts |
| High CLS | Images without dimensions, late banners | Reserve space, set sizes |
| Slow admin and front end | Database or hosting | Query audit, object cache, PHP upgrade |
| Fast homepage, slow inner pages | Template-specific plugins or queries | Template-level profiling |
Keep the Site Fast After You Fix It
Speed decays. New marketing tools, new plugins, and new content add weight every month. Set a performance budget (for example, LCP under 2.5 seconds and no more than a set amount of JavaScript on key templates) and check it monthly as part of a maintenance plan. Softvole includes performance checks in website care and optimization, and our QA checklist covers speed checks before launch.
Special Cases: WooCommerce and Membership Sites
Stores and membership sites cannot rely on full-page caching for logged-in users or carts, so database and object caching matter more. Watch cart fragments, heavy product filters, and analytics scripts on checkout. Test speed on product, cart, and checkout templates, not just the homepage.
Diagnostic Tools at a Glance
| Tool | Use it to |
|---|---|
| PageSpeed Insights | See lab and field Core Web Vitals together |
| Chrome DevTools Performance panel | Find long tasks hurting INP |
| Query monitoring plugin | Find slow and duplicate database queries |
| Server logs and APM | Spot slow PHP processes and timeouts |
| Uptime and speed monitoring | Track regressions over time |
Read more about responsiveness in web.dev’s INP guide.
A Diagnosis Workflow You Can Repeat
Random fixes waste time. A repeatable workflow finds the real bottleneck in under an hour for most sites.
- Pick the right pages. Use analytics to find the three templates with the most entrances from search and ads. Speed on those pages matters most.
- Check field data first. In PageSpeed Insights, see whether real users experience poor LCP, INP, or CLS. If field data is good and lab data is bad, the problem may only affect certain devices.
- Run three lab tests. Use the median, since single runs vary. Note the LCP element and the largest scripts.
- Measure server response time. If time to first byte is slow on a cached page, look at hosting and caching before front-end fixes.
- Profile uncached requests. Log in or bypass cache to see how long WordPress takes to build the page, and which plugins or queries dominate.
- Fix one thing, retest. Changing several things at once hides which fix worked.
Fixing LCP Step by Step
Largest Contentful Paint is usually a hero image, a large heading, or a video poster. Its timing breaks into four parts, and each needs a different fix.
| LCP phase | What slows it | Fix |
|---|---|---|
| Time to first byte | Slow server, no page cache | Full-page caching, better hosting, CDN |
| Resource load delay | Image discovered late (CSS background, lazy loaded, injected by JavaScript) | Use an image element in HTML, remove lazy load, add high fetch priority |
| Resource load time | Image too large | Correct dimensions, modern formats, compression |
| Render delay | Render-blocking CSS, fonts, scripts | Inline critical CSS, defer scripts, preload key font |
Fixing INP Step by Step
Interaction to Next Paint measures how quickly the page responds when someone taps a menu, opens an accordion, or adds to cart. Poor INP almost always comes from long JavaScript tasks running on the main thread.
- Record an interaction in Chrome DevTools and look for long tasks over 50 ms.
- Identify which script owns them; tracking tags, chat widgets, sliders, and page builder scripts are frequent offenders.
- Remove what is not needed, delay what is not urgent until after interaction, and replace heavy sliders with simple CSS where possible.
- On WooCommerce, check cart fragment scripts and product filter scripts on archive pages.
Fixing CLS
Layout shift happens when something appears and pushes content down. Common causes are images without width and height, cookie banners inserted at the top, late-loading ads or embeds, and web fonts that change text size when they load. Reserve space for every element that loads late, keep banners overlaid rather than pushing content, and choose fallback fonts with similar metrics.
How to Tell If Hosting Is the Real Problem
Hosting is the bottleneck when cached pages are still slow to start, when the admin area is sluggish even with few plugins, when performance drops sharply during traffic spikes, or when the host limits PHP workers so uncached requests queue up. Shared plans with older PHP versions often show all four. A move to managed WordPress hosting or a well-configured cloud server frequently delivers the single largest improvement.
Speed Myths That Waste Time
- “A perfect score is the goal.” The goal is good Core Web Vitals for real users on key templates. A 100 score on a homepage nobody lands on helps nobody.
- “More caching plugins mean more speed.” Two caching layers that conflict can make things worse. Use one clear caching strategy.
- “Plugin count is everything.” One heavy plugin can do more damage than twenty light ones. Measure, do not count.
- “Speed is a one-time project.” Every new script and plugin adds weight. Without monthly checks, speed decays.
Connecting Speed to Business Results
Speed work is easier to approve when it ties to outcomes the client tracks. Compare bounce rate, conversion rate, and revenue per session before and after, using the same traffic sources and similar time windows. For paid campaigns, look at landing page experience and cost per lead. Report speed improvements alongside these numbers rather than as standalone scores.
Speed Priorities by Template Type
| Template | Most common bottleneck | First place to look |
|---|---|---|
| Homepage | Hero sliders, video backgrounds | Replace sliders with a single optimized image |
| Blog post | Embeds, ads, social widgets | Load embeds on interaction |
| Service or landing page | Tracking scripts, chat widgets | Script audit and delayed loading |
| Product page | Image galleries, review widgets | First image priority, lazy load the rest |
| Shop archive | Filter queries, many thumbnails | Query optimization, image sizes |
| Checkout | Payment and fraud scripts, uncached requests | Object caching, remove non-essential scripts |
Matching fixes to template types prevents a common waste: polishing the homepage while ad traffic lands on slow product or service pages.
Setting a Performance Budget Clients Understand
A performance budget is a short list of limits the site must stay within, such as LCP under 2.5 seconds on key templates, total JavaScript under an agreed size, no more than a set number of third-party scripts, and image weight limits for hero images. Write it in plain language, share it with the client’s marketing team, and check new tools against it before they are added. It turns speed from a one-time fix into a shared rule.
Reporting Speed Work to Clients
Present before and after numbers for the same templates using the same tool and settings, with field data noted separately because it updates over 28 days. Explain the top three changes in plain language and connect them to a business metric such as bounce rate or conversion rate. Close with the performance budget that will keep the gains in place, so the client understands that speed is maintained, not fixed once.
Want speed handled as ongoing work? Routine performance checks can run inside a white label website care plan, behind your agency brand. Larger fixes, such as replacing a page builder or rebuilding templates, are scoped as separate projects. Before any handoff, run the WordPress QA checklist.